
Using machine learning to predict (& prevent!) injuries in endurance athletes: Part 1
Alan Couzens, M.Sc. (Sports Science)
Dec 12th, 2016

In previous posts I’ve talked a lot about performance modeling. I’ve investigated different ways that we can assess the individual ‘dose->response’ relationship or, more specifically, how we can work out just “what it takes” for a given athlete to reach a given performance level. In this post, I showed how we can use machine learning techniques (specifically neural networks) to improve on some of the current 'dose->response' performance models that, given recent advances, are largely out-dated. I suggested that we can find significantly more predictive accuracy by adopting models that look at the independent impact of volume & intensity rather than wrapping these variables into one ‘training stress’ metric.
But there is another addition to the current performance models that is far more important and has the potential to be even more powerful in its application than load->fitness modeling:
Turning our focus to those things that prevent us from ultimately doing more load! i.e. looking at just what leads to injury/illness in athletes & using our model to avoid both!
This is the flipside of the ‘more is better’ dose->response model. Generally, these models assume that, to a certain extent, more ‘dose’ = better ‘response’, i.e. more fitness! But this model doesn’t account for the other possibility – “more dose = sick/injured athlete”! The optimal model will look at both of these outcomes & find the ‘sweetspot’ between the 2: Sufficient load that maximizes performance improvement while also keeping the athlete healthy!
This ‘flipside’ of performance modelling (dose->injury) is a popular research area currently. Tim Gabbett is leading the field with his work on the relationship between chronic:acute load ratios and injury risk. While this research is filling an important void in looking at the other side of training load (i.e. injuries rather than just performance), in my view, this single variable focus is very limiting in its predictive validity. Won’t an athlete who does everything ‘right’ (sleep, good nutrition, low stress etc) be able to handle a higher acute:chronic ratio than an athlete who doesn’t? If so, shouldn't we research more than just load->injury relationships? And more to the point – in this day and age, why don’t we factor all available variables into the mix concurrently to come up with the best real-time personal risk model for the individual athlete?
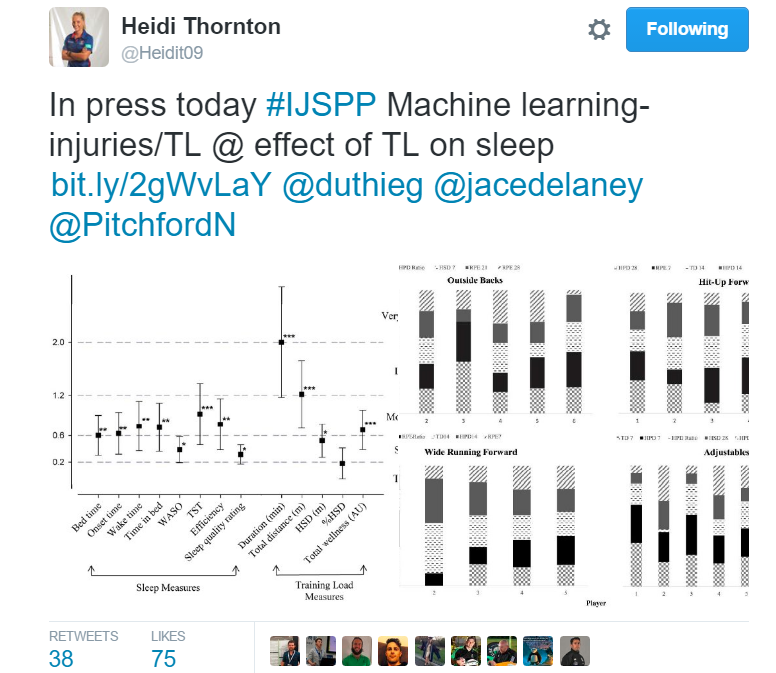
As I’ve outlined in previous posts, we have good algorithms that can deal with these multiple inputs. Logistic regression is one technique that does particularly well in factoring multiple inputs (sleep, load etc) into classification tasks (injured v not injured). Some new and exciting research is starting to take on this ‘multi factor’ approach. And, of course, my fellow Aussies are leading the way As the tweet below references, Heidi Thornton is at the forefront of implementing machine learning techniques to assess the impact of multiple variables such as sleep and training load on the injury risk of athletes. In this case, rugby players. (click pic to link to study)
While relatively new in their application to the field of sports science, the use of multi-factor predictive models to aid health isn’t a new concept. For years, some of the more technologically advanced hospitals have been implementing machine learning to assist in diagnosis of various conditions. For example, the University of Wisconsin has been using predictive modeling to assist Doctor’s in the diagnosis of breast cancer. Here is a landmark study that outlines the method in more detail, but in summary, individual cases are assessed for particular features that are typical of malignant vs benign tumors. In much the same way as a trained Doctor might look at a given tumor, a ‘machine’ is taught to make similar assessments to aid the Doctor in his diagnosis. The computer simultaneously assesses multiple features of the tumor (texture, size, concavity, symmetry etc) to classify the tumor as likely falling into the benign or malignant category – based on thousands of other tumors from each that it has ‘seen’. It diagnoses the likelihood that a patient is likely to get sick based on data from a number of features about that patient.
While season-interrupting injuries pale in comparison to the above use of predictive modeling, our goal is fundamentally the same, i.e. diagnose the likelihood that a patient(athlete) is going to get sick/injured based on data from a number of features about that patient(athlete). Since, the overall pattern is very similar (input of certain features leading to output of sick/injured), in similar way that the computer aids the Doctor in diagnosis, the computer can act as a very helpful 'assistant coach' in planning the right 'treatment' to head off future problems before they occur.
First step: Define the predictive features.
What do we want to look at as ‘likely suspects’ that might predict future injury?
- Sleep? (or lack thereof)
- Stress?
- Training Load (Both absolute & Ratio of chronic to acute??)
- Height/Weight (BMI)?
There are no limits here, only the processing power of your CPU! (actually, that's not even a limiter these days but that's a topic for another post :-) But in the interests of simplicity, let’s start with these 4.
We’ll use logistic regression in a similar ‘diagnostic’ way as the breast cancer example above to look at these features for 2 groups – an injured group & a non-injured group to see if any patterns occur. We’ll then apply these patterns to athletes that are not yet injured to assess their likeliness in becoming so based on their current inputs. Of course, if the model predicts an injury is likely, we may want to change some of these inputs to prevent that – decrease load (or make load more appropriate to current base) &/or sleep more, decrease stress, eat better etc.
A neat feature of logistic regression is that it doesn’t just classify athletes into injured/non-injured likely states but it also provides an actual probability number for each, e.g. if athlete Bob Smith decides to double his volume this month, there is a 73% chance that Bob will get injured. Coach and Bob can then sit down and make a call on this based on their risk tolerance. If Bob is on the cusp of a Kona slot, maybe it’s a risk he’s willing to take. But, at the very least, this approach offers both the opportunity to make an informed decision.
This exact same model of quantifying risk is used in a number of industries where risk matters(!) e.g. credit ratings, insurance premiums etc. These industries have long moved beyond relying on an agent with a 'good eye' determine if someone is a good risk. These days, the agent does little more than feed the data in, hit compute and let the algorithm do its thing!
I've implemented the above approach - using those input variables plus a few more to predict likelihood of injury as a simple web app to help guide decisions within my team (as shown in the screenshot below)..
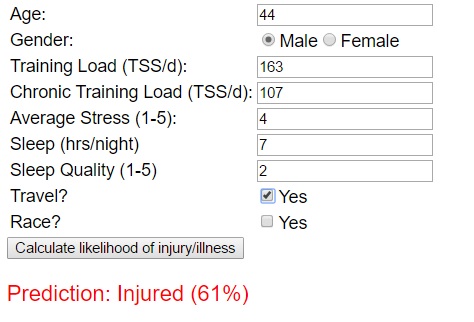
I had a request to start to include more ‘pure code’ examples in my blogs. Since I’m advocating that everyone should learn to code(!), it seems only fair :-)So, in this post & the next, I want to get down to some of the nitty gritty of how you can use some of the available machine learning tools to build a practical application like the one above - something that can help you assess risk and make intelligent, informed, 'data-backed' decisions. Let’s get started...
First step in developing our code is to format our data into a way that the computer can understand. Python has a number of ‘plug & play’ libraries that are a huge help when it comes to data analysis. One of these is numpy – which we will ‘import’ a little later to make our job easier. Numpy likes its data to be fed to it in array form. An array is basically a list defined by [] and separated with commas. For example, for 1 athlete looking at sleep (hrs), stress (1-5 scale), Training load (TSS/d), ATL/CTL ratio, BMI, our data array might be..
[8.0, 3.2, 105.0, 1.4, 21.1]
This array could be stored in another array called athletes with a bunch of other athletes…
e.g.
athletes = numpy.array(
[8.0, 3.2, 105.0, 1.4, 21.1],
[9.1, 2.0, 130, 1.3, 22.0],
…. ])
Athlete 1 gets 8.0 hrs of sleep per night, has a mean stress of 3.2… Athlete 2 gets 9.1hrs of sleep per night, has a mean stress score of 2.0 etc. Perhaps counter to our central thesis on injury, when it comes to data, more is generally better :-), i.e. a model fed with data from 100 athletes is likely to produce a better model than a model fed with data from 10 athletes or, perhaps even more the case, 100 months of training data for an individual athlete is likely to produce a better model than 10 months of training data. In other words, keep collecting that precious data!

:-) More data to your coach = better insight about you as an athlete!
Once we have the input array, we also need an output array of the dependent variable being tested, in this case – injured v not injured. This can be easily described as 0’s for ‘not injured’ & 1’s for ‘injured’ like so…
injuries = numpy.array([
1,
0,
…])
The above output array says that our 8hr sleep, 3.2 stress score etc athlete above got injured (score of 1 in the corresponding row), while our 9.1hr, stress score 2.0 etc athlete did not get injured (score of 0 in his/her row).
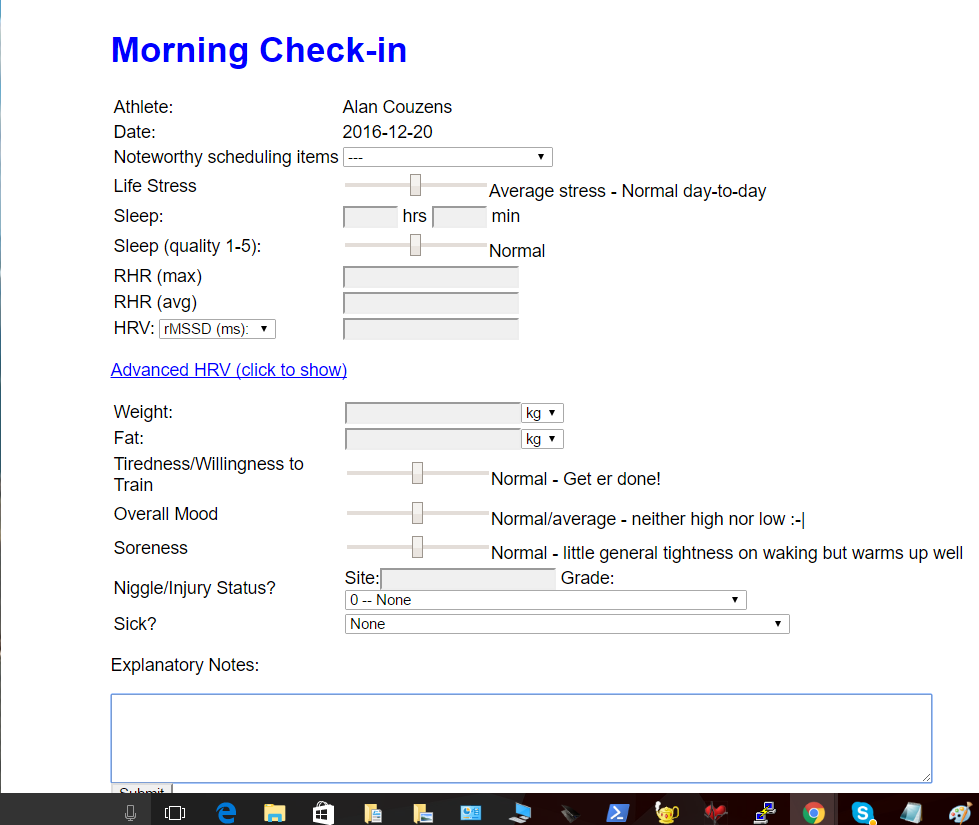
If you’re 'playing along' with your own data, your homework is to get together 2 arrays like the above – 1 holding your input categories & the data & the other holding the ‘outputs’ for each of those months – in this case a 0 for a non-injured month and a 1 for an injured month.. The easiest way to build the above arrays is to begin to store your daily data in a database or even an excel spreadsheet. That is what I do with my athletes via their training log that pulls summary data from Training Peaks & a simple ‘morning check-in’ form that let’s me know the athletes sleep, stress, weight and injury status for a given day. This is shown below...
Even without going to the extent of setting up a database, you could easily build a google form that does the same thing and pushes your information to a basic spreadsheet. If you have your data in that format, you can easily set up your code to pull directly from that sheet to build the above arrays (so that you don't have to enter any of the data by hand).
However, even if you don’t have a nice pre-built database of hundreds of thousands of rows to draw from, if you’ve been tracking your training on Training peaks for a period of time, it’s easy enough to manually put the monthly stats from one athlete into the above arrays. Even with several years of data accumulated, you can fairly quickly look at most of your monthly totals from Training peaks’ ‘dashboard’ tab. You can see your average training load (TT/month) on your ‘Fitness History’ table on your dashboard (divide by 30 to get average TSS/day for each month). You can get peak CTL & ATL stats for each month from your performance management chart and you can see your metrics (sleep, stress, BMI) on the metrics chart. To get started, put those numbers from your last 12 months or more into an array format like we have above and save it in notepad (or your favorite editor) a file called injury.py.
So, end result will be a file saved as injury.py containing a dataset that looks something like the one below, which contains a short random sampling of the above data from 10 of my athletes just to illustrate the method (hopefully yours will have many more rows for every block of training/recovery data that you've been recording :-)…
athletes = numpy.array([
[8.0,3.2,105.0,1.4,21.1],
[9.1,2.0,130,1.3,22.0],
[7.0,4.1,82.0,1.1,23.1],
[7.7,3.0,110,1.4,22.3],
[8.0,2.2,128.0,1.5,23.3],
[8.3,3.0,150,1.3,21.5],
[8.0,3.3,182.0,1.6,24.0],
[7.7,3.0,110,1.4,22.3],
[8.5,3.2,150.0,1.3,23.0],
[7.1,4.0,100,1.3,24.2],
]),
injuries = numpy.array([
1,
0,
1,
0,
0,
0,
1,
0,
1,
0,
])
In my next post, I’ll show you how you can add some of Python’s machine learning libraries to your injury.py script to build your injury predictor model from this data and then we’ll get to the fun stuff of using that model to a) predict if you’re likely to get injured with your current training/lifestyle and b) test out some changes to load or lifestyle that is likely to ward off that very sucky season-ending outcome! In part 3, I’ll reveal some of the insights on factors impacting injury risk that I’ve learned from running the above analyses on my squad database of 30,000+ training/metrics files.
Until then…
Train smart,
AC
TweetDon't miss a post! Sign up for my mailing list to get notified of all new content....