
‘Data Mining’ the volume vs intensity debate Part 2:
Volume AND Intensity.
Alan Couzens, M.S. (Sports Science)
June 1st, 2016

In my last post on this topic, I put on my hard hat & set about ‘mining’ my 20,000+ training files from all levels of triathlete, from novice to pro, to answer the question – which is more important, volume or intensity?
You can read that post here, but in summary – volume is winning by a nose. However, the real leader is a metric that combines the 2 together into a cumulative ‘training stress score’, i.e. the question is not so much volume OR intensity, but rather, what combination of volume AND intensity?
You might be thinking, well, with the introduction of a metric that brings together volume & intensity, (i.e. TSS) – problem solved! But, not so fast!
In reality, the correlation between TSS and fitness is still relatively low & I suspect that a lot of this comes down to one inescapable truth, despite the intent of coming up with one common currency, in real world application, not all TSS’s are created equal!
While in TSS world, an hour at threshold (e.g. a 40K Time Trial) and 2hrs of easy-steady aerobic training might give the same number, we know that they are, in practice, definitely not the same thing! Both in terms of the fitness that each brings and also the recovery that each necessitates!
No, we need a better descriptor, something that actually includes both of these independent variables of volume & intensity rather than wrapping them into one with a bunch of assumptions thrown in.
This is tricky!
Mathematics & statistics do well with 2 variable equations – input -> output. That’s fundamentally why things like TRIMPS and TSS were created – to make sense of multi-variable inputs. At the time it streamlined things. But now, we have models that can successfully incorporate multiple variables. I talked about one of these – logistic regression in a previous post.
The downside of logistic regression is that, while it does a great job with linearly separable outputs e.g. yes/no questions (will I qualify for Kona? etc.), it is not applicable for continuous output variables e.g. race times, FTPs, VO2max values etc. In other words, it is not a great method of handling data for a lot of the specific questions that we want answered! So what can we do?
In that post, I briefly mentioned artificial neural networks – algorithms that mimic the way that the human brain learns something – with ‘neurons’ that progressively ‘wire together’ to strengthen successful input->output relationships. As it turns out, this model is very useful for dealing with the continuous output variables that we want to predict as coaches/sports scientists, e.g. race times or fitness metrics such as watts per kilo or VO2max.
A brief explanation of how neural networks work is shown in the figure below (from Wikipedia - click the figure to learn about Neural Networks in more depth)…
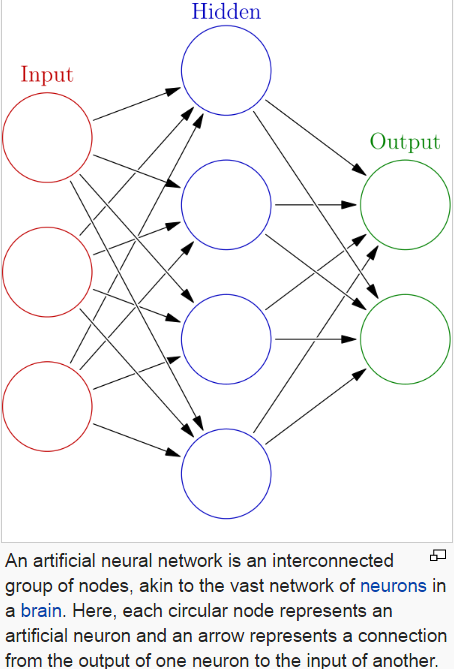
Basically, input variables are ‘fed’ into the network. The network applies weights to the variables, 'feeds them forward' through activation functions in one or more ‘hidden’ layers & then it spits out an output variable on the other side. The output that the network comes up with is compared against the ‘true’ output in a training set, weights are progressively adjusted accordingly by 'back-propogating' the errors back through the network and the feed-forward/feed-back process is repeated until the network output and the true output line up sufficiently. Voila, a model.
Because of the ‘hidden’ layers, neural networks have been dubbed mysterious, complicated ‘black boxes’ but, in reality, they’re not that mysterious or complicated. Admittedly, the number of nodes and layers leads to a big, messy equation but the equation itself (while big) is simple enough & easy to mathematically define. For our purposes, the hidden layers can be thought of quite simply as….
A big stack of logistic regression functions
In my last post on using data science to mine our training data for actionable insight, we looked at how we can take a series of weighted variables and pass them through a sigmoid function to express non linear relationships between independent and dependent variables as shown in the formula below…
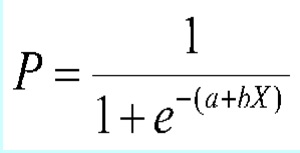
This is a big step forward in that we now have a model that can deal with..
- a) Multiple input variables (e.g. volume AND intensity) &
- b) Non-linear relationships between independent and dependent variables (e.g. training load->fitness).
So, how can we use this new ‘whizz bang’ technology to improve our training -> performance model?
This bring us back to the initial problem of having to ‘wrap up’ volume and intensity into one input number (TSS). By employing neural networks we no longer have to do that. We can take volume and intensity (& anything else you want to throw into the mix) and consider their (separate) influence on an important continuous variable like functional threshold power.
The advantages of using this more complex model in a performance prediction sense is already being shown in the literature. For example, in this study by Silva et al., by implementing a very simple (one layer, 3 neuron) neural network model, the authors were able to accurately predict swimming performance with an error of only 0.8% (less than a second over a competitive 200m)!
I have seen similar power in my own data. Below you'll see the data from an actual neural network that rolls through the 20,000+ files on my database & uses that data to build a representative model to answer our question on the relationship between monthly volume (hours) AND intensity (intensity factor) AND performance (watts per kilo at FTP) below.
To illustrate the simplicity of a neural network 'in action', here is an actual representation of the model with the lowest error that the neural network came up with, with the relative weights shown as the width of each arrow (bigger arrow = more weight given to that variable/node). The sigmoid function of each node is shown in the hidden layer and the output weights that contribute to the overall 'performance' function are shown on the back side
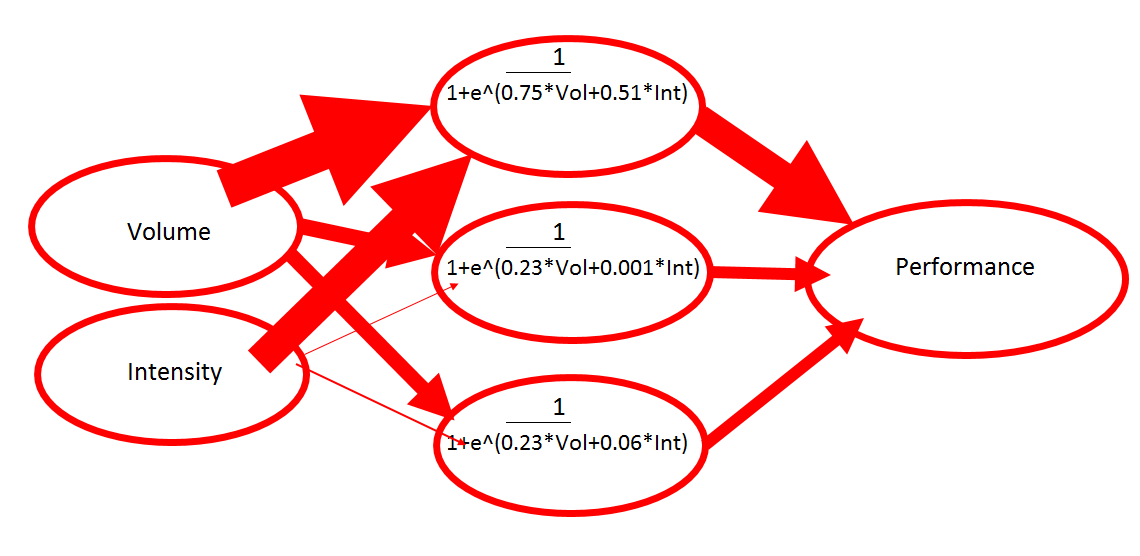
And here are the predictions that the above trained model produces....
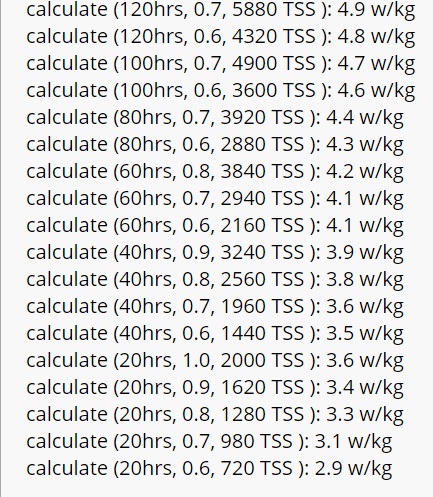
You can see the power of this sort of model to explain non linear relationships, e.g. the relationship of ‘diminishing returns’ between more work & the performance gain that it brings...
Increase the volume from 40-60hrs per month and you get ~0.5 w/kg. Increase it by another 20 to 80hrs per month and you only get an additional 0.2 w/kg, i.e. the relationship between work & performance is non-linear.
You can also see, per the larger point of this post, that while TSS tracks relatively poorly with performance (with higher volumes tending to yield better performance even at lower TSS), if we break that TSS up into its constituent parts of volume AND intensity, the picture is much clearer.
And what is that picture?
Most athletes significantly underestimate the benefit of volume on performance and significantly over-estimate the value of intensity on performance.
While both come into play, speaking generally, it takes a lot of intensity to make up for relatively small reductions in volume.
The ‘speaking generally’ is important. There are individual variations in these volume + intensity -> performance relationships. Given a sufficient amount of data, with a simple change in the database query to only pull files from a given athlete, we can individualize the model so that it represents a given athlete's best personal training->performance relationship. We can then begin to use this prescriptively to craft new, previously unseen, performance levels for that athlete.
An additional consideration when applying the model - more is only more until your body can’t do more! :-) There is another relationship that we want to investigate to fully illuminate the picture – the model of training input(s) & the athlete’s tolerance to the load – i.e., in addition to what inputs lead to high performance levels, we also want to know what inputs lead to an athlete being tired, sick or injured (esp with respect to that volume/intensity balance). I talk about how we can apply machine learning to do just that in this post.
Until next time…
Train smart,
AC
TweetDon't miss a post! Sign up for my mailing list to get notified of all new content....