
Data v Dogma II:
Making use of your data
Alan Couzens, MS (Sports Science)
April 14th, 2016
The multi-talented guy in the video above, wrote a great introductory read on today's topic - Predictive Analytics. Highly recommended. Below is a quote from another recommended read that I referenced in my last post...
"“A frequently heard objection (to the introduction of data science) is that data can’t replace human intuition. In fact, it’s the other way around: Human intuition can’t replace data! Intuition is what you use when you don’t know the facts and since we often don’t, intuition is precious. But when the evidence is right before you, why would you deny it?”
.
- ‘The Master Algorithm’ Pedro Domingos
I had a bit of a rant in that post about the importance of basing your training program on objective data v subjective dogma. It clearly struck a chord with a lot of you but at the same time left you wondering...how?
I got a lot of questions as to the software that I recommend to make sense of and (more importantly) make use of the mass of data coming into us coaches each & every day &, the honest (though maybe less than helpful :-) answer is, I write my own. There are some great web apps available that do a good job of collecting, organizing & ‘beautifying’ your data but few do a good job of synthesizing this mass of data into truly use-able, actionable, insight as, for example, some finance applications do: Explicitly telling you what the data suggests is your next 'best move' - buy this, sell this, do this.
While, learning a programming language might be asking a bit much, there are some basic ‘data mining’ techniques that can be implemented fairly easily in Excel that can significantly help sifting through this mass of data to identify patterns & predictions that can drive a training plan. I outline an example of this process below.
I remember one of my high school teachers saying that a teenage boy’s obsession with sex is much like a dog chasing a mail truck – if he caught it he wouldn’t know what to do with it. I think of endurance athletes (& coaches) current obsession with collecting training data in a similar way. Everyone is on the hunt for more data, more gadgets. The focus is collecting more rather than using what we already have to the utmost (I’m fighting the urge to go off on another philosophical rant here :-) In our world, being a ‘data geek’ means you own all the gadgets and download your files. In the real world being a data scientist means that you don’t just collect numbers, but you actually use this information to generate insights that you can apply to practically direct & optimize the training (or financial, or business, or marketing) plan.
Put more plainly, a lot of the variables that we collect data for never find their way to any predictive or prescriptive model. They're just hanging out in the cloud. It begs the question, why we are collecting them in the first place? Presumably, for that time in the future when we have the technology to integrate the data from all of the variables at our disposal in a usable way. Well, that time is now!
The dose-response model of Bannister (on which Training Peaks/WKO+ Performance Management Chart is based) is now almost 30 years old. It is a 2 factor model (input=training load, output=performance). At the time it was introduced, it was challenging enough to keep track of these 2 variables! That was before big data! Now we have many more variables that we could incorporate but we're still stuck with this 1-2 factor model.
The dose-response model is a good 'first try', but any coach or athlete who has followed it long term, knows full well that often times real fatigue and theoretical 'model' fatigue don't match up. This is simply because there are a lot of other variables which affect fatigue (& performance) beyond pure training load. The good news is, we have access to these variables. They're hanging out in the cloud just waiting to be used! More good news: We also have computer models that can potentially accommodate multiple variables, but...we're going to need to significantly broaden our data skill-set to use them. That is the purpose of this post. Let's meet the models...
I mentioned machine learning in the last post. This is a nebulous concept, even among the tech savvy. The complexity of the concept leaves a lot of its practice confined to particular programming languages that implement machine learning models and algorithms in libraries that are specific to that language. While it certainly can be a complex area, both mathematically and programmatically (& a source of daily headaches for a humble physiology guy trying to wrap his head around it) some of its principles can be applied on fairly basic levels with basic data skills.
The whole concept of machine learning involves ‘training’ an algorithm to spot patterns between 2 data sets – an input and an output..
e.g. a well known machine learning car data set…
Inputs:
- Car Weight
- Engine displacement
- Cylinder Count
- Horsepower
- Hybrid or Gasoline
Output: Miles per gallon
At its heart, machine learning is about your computer calculating this relationship between multiple variables and expressing it as a formula/algorithm that can be used for future prediction. In the above case, we would 'feed' the computer the known training set where we know both the inputs (weight, displacement...) and the output (miles per gallon) so it ‘learns’ the relationship between the 2. Then we would sit it down at the proverbial school desk and test just how well it learned by asking it to predict miles per gallon based on all the inputs for a car that it has not yet seen, i.e. by proving it's ability to do so it has 'learned' a generalizable pattern.
You might be already seeing the applicability of the above to what we do in working with individual athletes, each with their own weight, fuel economy and ‘horsepower’.
If you’ve ever played around with an Excel scatterplot and added a trendline with an equation, congratulations, you’ve built a machine learning model! Not a great one, but a model nonetheless.
The simple linear regression provided by your excel spreadsheet fails us in 2 main ways….
- Like the Bannister model, it still only looks at the relationship between 2 variables.
- It assumes a linear relationship, i.e. if you look at volume vs Ironman time, the linear model would assume that if you double your volume you double your results. We know that, in reality, it doesn’t tend to work this way.
You can see this in a previous blog post that I did analyzing the relationship between volume, intensity and performance. If you carefully look at the scatterplots, you'll see that the true best fit line of the data in the volume and intensity graphs is more a curve than a straight line. The linearity of the CTL chart is better but that's because CTL is inherently non-linear as it raises TSS to the power of an arbitrary CTL constant (42 days being the default). Clearly better than a linear model but still not perfect. It still only incorporates 1 input (TSS) and the exponent is arbitrary and untested in the PMC model.
So, what’s our alternative?
There are a number – decision trees, support vector machines & the coolest of all – artificial neural networks, which simulate the way that the human nervous system actually works in learning (here is a great example of how a multi-input neural network was used to model swimming performance). But a good starting point for our purposes and a good balance between power and simplicity comes in the form of logistic regression.
Logistic regression involves passing multiple independent variables through a sigmoid function to assess their probabilistic relationship with a binary output variable, i.e. you can plug in numbers (or categorical data) and assess how important they are to a 'yes/no' question.
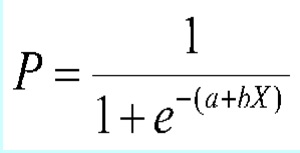
Because it passes the independent variables through a non linear function (i.e. the variable X is 'raised' as the exponent of e in the formula above), it doesn't assume linearity between input & output variables (i.e. increasing your training volume by a factor of 2, doesn't equate to halving your Ironman time!). Logistic regression also solves the problems of simple linear regression by allowing for multiple input variables in explaining the net probability of the dependent variable (e.g. the relationship between weight AND cylinder count AND horsepower ON whether a car is or isn't fuel efficient). You can read up more on the ins and outs of the math behind logistic regression here. Don’t panic if your math is a little rusty, Excel has some built in functions to do the hard work for you….
While Excel is great for manually ‘plugging and playing’, in this day and age of 'the internet of things', the power of analysis goes through the roof when we link our algorithms up to all of our athlete’s training data & feed the models on the ‘big data’ that is inhabiting the world-wide-web. This requires putting the above excel functions into a language that can do things like plug into the mass of data available on Strava, Garmin Connect & Training Peaks.
To this end, I used the same basic process outlined in the Excel article to code up a very simple example of machine learning that illustrates how we can use logistic regression to ‘solve’ the multiple input variables listed above to answer a simple question that is very specific to our little world…
'Coach, can I qualify?'
Output : qualified for Kona/ didn’t qualify for Kona
Inputs:
- Volume of training in the year leading in
- Intensity of training
- Average hours of sleep per night
- Number of Ironman races that year
- Location of KQ race
Really, any input variable that you’re collecting data on can be thrown into the equation to have its importance assessed &, in this day and age, we have the ability to collect a lot of input variables! We could break volume down by intensity zone. We could break volume or intensity down by month leading in. We could add total number of long rides/big days. We could add anthropometric data, we could add the number of travel days in a year etc. We’re not limited by access to data any more. Only by our curiosity & our imaginations.
And… the more data you feed it, the smarter it gets! Or, in this case, the more it learns about Kona Qualifiers. This is all without me telling it anything specific about what I think separates Kona Q’s from non-qualfiers. Providing I can put the data into a format that the computer understands, I could just as easily be feeding it move data from chess matches & having it ‘learn’ good from bad moves. I know very little about chess strategy & would do a poor job of manually programming winning moves, but given enough data, the computer can use this process to, in essence, program itself, becoming far more knowledgeable than its programmer in just about any field & in the process, can teach its programmer a thing or 2!
In this particular case, the input-output data is broken up into a way that the computer understands as follows
Qualifiers (Volume in hours, training intensity, average hours of sleep per night, number of Ironman races in that year, location of qualifying attempt – 1 for America, 2 for Europe, 3 for Asia-pacific) We plug this individual athlete data into the computer as a big ‘array’ of numbers that the computer can make sense of, with each line representing one athlete…
$training = array(
array(860., 0.69, 7.8, 3.0, 0.0,),
array(971., 0.73, 9.2, 2.0, 0.0),
array(870., 0.74, 7.3, 1.0, 0.0),
array(862., 0.72, 9.7, 1.0, 2.0),
);
Non Qualifiers
array(622., 0.82, 7.2, 1.0, 0.0),
array(561., 0.65, 9.5, 1.0, 0.0),
array(481., 0.73, 6.5, 1.0, 1.0),
In other words, athlete 1 (a qualifier) did 860hrs at an IF of 0.69, he slept an average of 7.8hrs per night, he did 3 Ironman races that year and his qualifier race was in America.
If you click ‘calculate’ below. The computer will go to work pulling the data above into a logistic regression that results in the maximum log likelihood function – i.e. the function that best fits the above data.
An important note: The quality of the prediction is only limited by the data that you provide. Before you get too carried away plugging in test cases, We only ‘fed’ this model a very small amount of training data above to keep things simple and illustrate the process. In order for the relationships to reach the level of statistical significance, we should include at least 10 samples per independent variable (i.e. 50+ samples in this case) In reality, we would link this bad boy up to a database and feed it a lot more data to increase its ability to accurately predict. Given sufficient multi-year data, this model can even be tailored to a given athlete, again enhancing its predictive abilities!
You can see the difference between this approach and a 'Dogma' approach. While our brains follow a similar ‘computation’ as experience accrues, i.e. identifying patterns between athletes who are successful and those who aren’t, it does so quite generally & with that unfortunate human filter of bias. We tend to pay more attention to the variables that strike a (subjective) emotional chord ( a well-written book, the words of a charismatic speaker, a well marketed/hyped training plan) and so we ascribe excessive weight to some areas and not enough to others. Additionally, we have a hard time moving away from our initial position and tend to seek information (data) to confirm/bolster our initial view. Your laptop has no such biases &, because of that, it is a powerful ally!
In keeping with the Math theme, if we were to honestly express the current data v dogma influence on training programs in the form of an equation it might be 10% data (objectively observed relationship between numbers and performance) + 90% dogma (stuff that I’ve read, stuff that coaches have handed down through the generations as fact) = 1 training methodology. While I don’t want to discount the importance of specific ‘domain’ knowledge (just yet), it’s high time that we break free from the chains of tradition that the old school coaches are loudly trying to reinforce & start to make full use of this new tool that is now available to us in an action-oriented way. The growth of data is only heading in one direction. As we, & our machine friends, work together to become smarter & smarter, there are some exciting times ahead. Embrace the change. Returning to Dominges’ “The Master Algorithm” for a closing word…
“If you want to be tomorrow’s authority, ride the data, don’t fight it”.
Train smart,
AC
TweetDon't miss a post! Sign up for my mailing list to get notified of all new content....