
Are you a 'High Responder’ to training?:
Putting the performance back into performance modelling.
Alan Couzens, MS (Sports Science)
Nov 20th, 2014
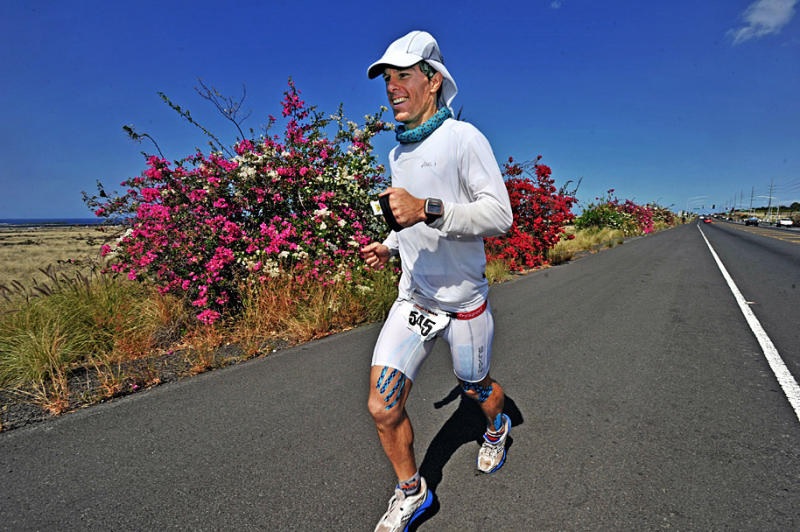
In a previous post, I talked a little about some of the different ‘types’ of athletes I’ve come across in my years of coaching. The guy smiling (in the midst of a double marathon!) in the pic above is Mike Coughlin, on his way to a 2nd place at the 2011 Ultraman World Championships. Mike is one of the fastest responders to training that I have had the pleasure to work with. Mike took himself from very average fitness levels to World Class levels for his event in the space of 16 (very hard) weeks of training. This is not a normal training response!
In that previous article, I alluded to a system of actually quantifying these differences in training response among athletes. In this article, I want to expand on that a little and give you a readily applicable practical assessment of whether you are a high responding ‘Natural’ (like Mike), an average responding ‘Realist’ or a low responding ‘Workhorse’.
I can’t claim any level of originality here, the study of quantifying the relationship between load and performance for different athletes has been around for several decades, beginning with the work of Bannister (1975). More recently it has been embraced & applied by the mainstream endurance sports community in the form of the ‘Performance Management Chart’ in software applications like WKO+ and Training Peaks, but it lost a little something along the way, namely the ability to model actual performance!
Let’s play a game of spot the difference: The original Bannister model is shown beside the modified Training Peaks model below.
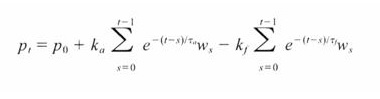
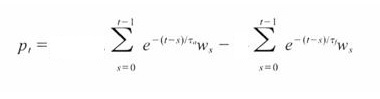
What’s missing? That’s right, those special k’s.
The k coefficients represent the performance part of performance modelling – weighting that sum of fitness and fatigue in a balanced way that represents actual performance shifts in the athlete over time.
In today’s piece, I want to focus on the first of these – ka – the fitness weighting coefficient. In simple terms, this number identifies how much performance ‘bang’ a given athlete gets per training load ‘buck’. For this reason, this number is absolutely essential if we want to start to try to predict actual performance for a given athlete (in power or pace terms) and it is also very useful in distinguishing between different types of athletes.
High ka = Higher performance for a given training load = High responder, or ‘Natural’ as I dubbed them in my last article. Mike’s ka is 0.3 – off the charts high, putting him firmly in the ‘natural’ category.
Low ka = It takes a higher training load to reach the same total performance number = Low responder or ‘Workhorse’. This is not necessarily a limiter in and of itself (I have trained several 'Workhorses' to Kona Qualification levels and beyond), it just means the athlete will need to put in more time & more miles to reach a competitive level. There are, however, other advantages that this type of athlete has when it comes to very long events.
You can see a visual representation of these 2 extremes below, with a graph showing the relationship between CTL and FTP (in watts per kilo) for a 'natural' and a 'worker'.
So how do we determine our own training response coefficient?
I’ve prepared a calculator below that you can use to help to identify your own ka & training response. Just plug in your body weight along with 2 known CTL and FTP numbers from different points in your season, ideally a lower number from the start of your season and a higher number from the peak of your season.
The calculator will give you a value for your ka along with an assessment of whether you fall in the 'natural', 'realist' or 'workhorse' category of athlete. It will also show you on the chart above where you fit in (with the relationship between FTP in watts/kg on the y axis and CTL on the x axis)
Once you’ve got a number, you can cross reference it with my previous article for more tips on the characteristics of your type and how you can apply that information to your training.
You can also begin to predict future performance by entering a future CTL target (in CTL3 above) and the calculator above will spit out a predicted FTP at that level of training load for a specific athlete. This is a useful 'reality check' when setting appropriate season goals for an athlete, based on their actual training response.
A couple of caveats when interpreting the data...
Caveat 1: These need to be good numbers – garbage in, garbage out. I won’t argue too vigorously on the nature of your FTP test at the moment (although I do have some thoughts on that), but, I will say that it is important that the 2 selected tests were consistent (same test, similar conditions).
Caveat 2: Two samples does not a scientific study make! To get a truly significant & thus reliable relationship, we want more than 2 samples, ideally we would perform this calculation many, many times through a season and come up with a ‘line of best fit’ through these points (as I do with the athletes I coach). This merely represents a fun starting point that will give you a general idea of where you fall on the ‘training response’ spectrum.
To learn more about athlete typing, come along to our Endurance Corner December Coaches Clinic in Boulder, CO (10 USAT CEU's available!).
Train smart,
AC
TweetDon't miss a post! Sign up for my mailing list to get notified of all new content....