How many days this year will you lose to illness and injury?
A predictive model
Alan Couzens, M.Sc. (Sports Science)
May 30th, 2017
In my last post, I looked at the question: Is elite sport healthy? Avoiding a knee-jerk response to the question, I took a look at what my own data had to say on the issue, specifically looking at whether my athletes training at the highest levels were significantly less healthy/significantly more injured & ill than athletes training at lower levels. While, I did find a general trend towards higher levels of injury in higher load athletes, I also found that there were a number of factors apart from load that play a significant effect on the overall health risk of training.
I looked at the impact of one of these – life stress, in that post and found that life stress has just as much impact on injury risk as training load. Furthermore, I suggested that many of the negative effects that we associate with high performance training and more the result of the combined stressors of a high physical training load along with the associated emotional/life stressors that come with being a high performance/professional athlete in modern sport.
In this piece I want to look at that relationship a little closer & attempt to actually quantify it in the form of a ‘living, breathing’ web-based injury risk model.
You’ll find that model below…
Just plug in your average life stress (on a scale of 1-5), your annual training volume (in hours), your average training intensity factor & your average ATL:CTL ratio and click submit. The model will run some calculations, preparing your numbers to data that it already knows & will then predict how many days you are likely to spend injured & ill this year.
This simple predictive model is built from the dataset of long term data from 96 athletes that I outlined in my last post. With the help of a linear regression algorithm, we have distilled the data into a representative predictive model that shows the impact of the various features on injury risk.
By playing with the sliders and clicking submit you can get a sense of that yourself. You can see how life stress impacts the risk of injury even at the same or lesser training loads. You can see how training volume and training intensity work together with regards to injury risk and which volume/intensity combinations for a given TSS load are the ‘safest’. Additionally, you can play around with the ratio slider, which bring in some of the stellar work of Tim Gabbett on the same topic by looking at how the ratio of Chronic & Acute load comes into play to determine injury risk….
Tim has found an exponentially greater risk of injury as the Acute:Chronic training ratio goes beyond 1.5 (as shown in the figure below).
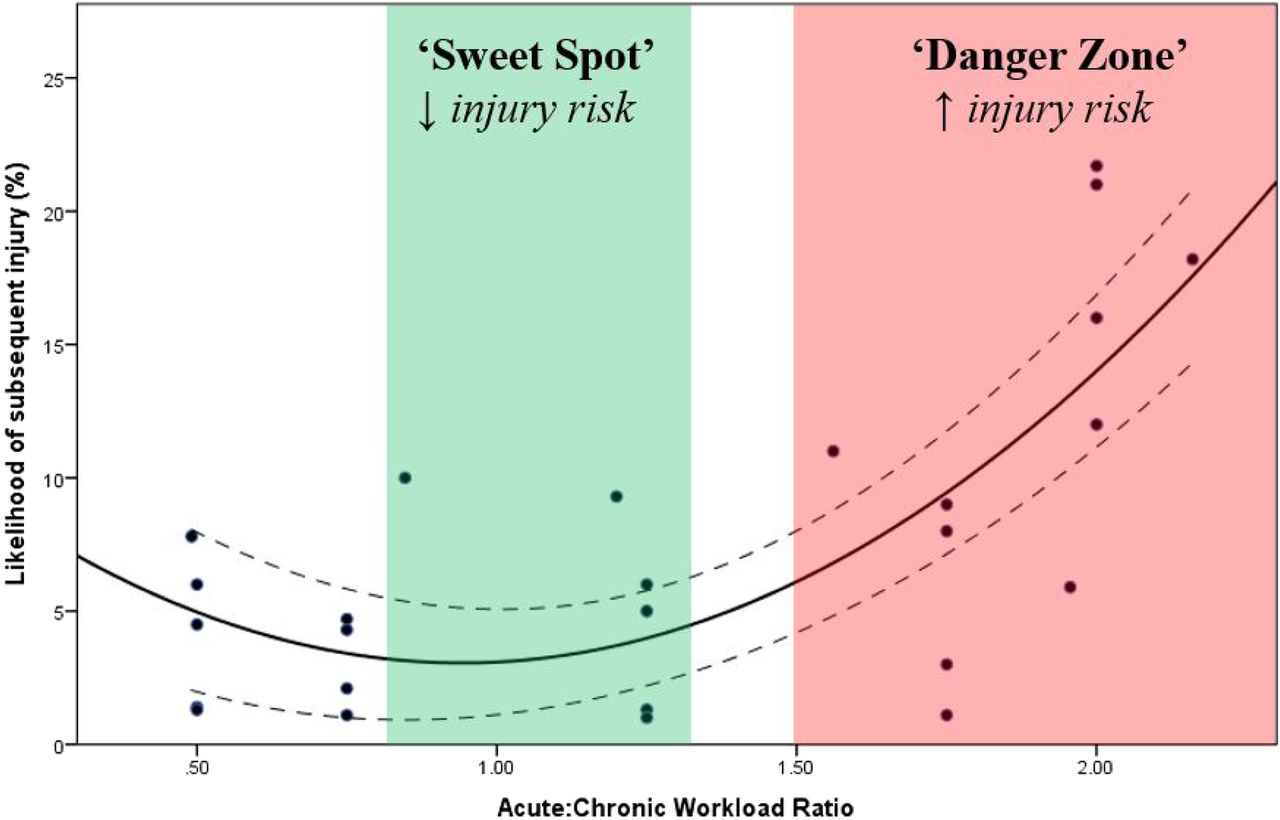
This data would support that. As the rate between acute and chronic load, (or the ‘ramp rate’ in Training Peaks terms) goes up, the rate of illness and injury also go up by a large margin! This data very much agrees with Cato the Elder. When it comes to mitigating injury risk over an athlete’s long term development…
“Patience is the greatest of all virtues”
Since this model is a simple linear model, based on Gabbett’s findings, I might expect an even better fit if I was to use a polynomial model to explain this relationship. However, even with this very simple model, by combining the effect of the multiple features above – life stress, volume, intensity and ratio/ramp rate into one, we end up with a pretty accurate prediction. The RMSE (link) of the model is 4.4 days. Meaning that the majority of scores fall within +/- 4.4 days of the predicted value.
In addition to the relationship between Acute:Chronic ratio and injury risk, some other important relationships are evident…
- If you slide the intensity slider from 0.7 to 0.85 (Z1/2 to mid Z3 training) the injury risk almost doubles!
- If you slide the ‘life stress’ slider from a mean stress of 3 to a mean stress of 4, it has a similar effect on the risk of injury. Even more significantly, going the other way, from a life stress of 3 to 2, the risk of injury more than halves. To me, this speaks to the ‘simple life’ common to so many high performance environments. If you really want to train at the highest level, simplifying the rest of your life & reducing other sources of stress has to be a high priority.
Perhaps of even more practical ‘real world’ significance though is when we start stacking the negative effects of multiple stressors. Take, for instance, the very real situation of an athlete who is time crunched due to a busy, stressful job and so he/she tries to ‘make up for lost time’ by cranking up the intensity. Let’s slide our sliders up to 4 & 0.85 and see what happens…
The athlete is predicted to spend a quarter of the year sick or injured. It should go without saying that this is no way to make year to year progress in the sport! Far better to back off the intensity during high stress periods and maintain fitness rather than losing it due to long term illness or injury and having to start again. And, if your whole life is one big ‘high stress period’, change it! Nothing is more important than your health. Money means nothing if you’re too broken to enjoy it.
The take home message is this – stress is stress. When one part of the slider is pushed to the right. We (coaches/athletes) must push another to the left or, mark my (& the data’s) words - somethings gotta give.
Train smart,
AC
TweetDon't miss a post! Sign up for my mailing list to get notified of all new content....