
In my last HRV post, I outlined a few of the practical issues (esp. for coaches) in keeping track of good HRV data. Namely... a) Many of the available apps significantly decrease the sensitivity of the data, diminishing its usefulness in distinguishing recovery days b) Most apps aren't well suited to the coach's need of easily keeping track of the HRV status of multiple athletes.
At the end of the post, I hinted at the ability to pull HRV data programatically directly from Training Peaks. This is something that I've been doing now for a few weeks for me and my athletes & I've found it super useful, so I figured I'd share it with you guys (in the hope that we get even more of you in on the HRV conversation).
You'll find that tool below...
You don't need any special hardware or apps to gather the data. Everything is pulled from regular HR files on your TP account.
Just enter your TP details above (you can find your 'person Id' at the end of your url when you log in to TP as below...)

and the dates that your want to pull data for and hit 'Get HRV'. The code will pull all HRV data between those dates and plot it on the chart.
To begin gathering data, simply put your HR strap on when you wake up in the morning, wait for it to settle then start your watch for at least a minute and upload the file just as you would any workout file (but as sport type 'other').
As long as the file is over 60s, and uploaded as 'other', it will pull HRV data from the file but my recommendation (& what I use for my crew) is a 2 minute test - 60s lying down followed by 60s standing
An example of what you'll see after you've gathered a few files is shown below...
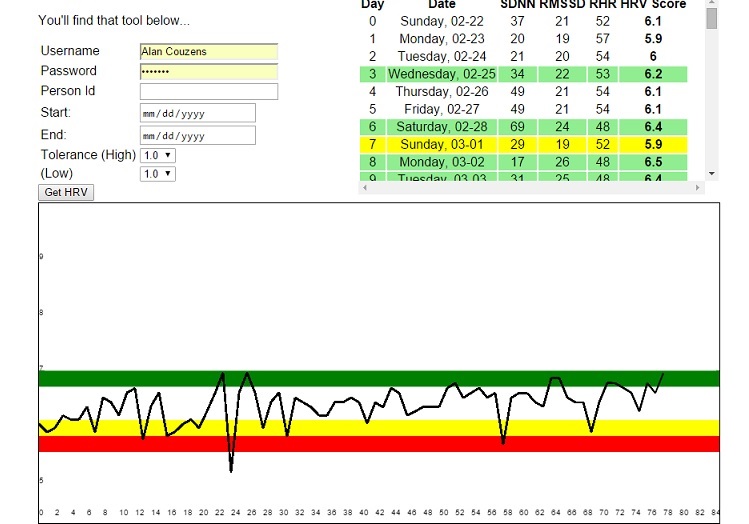
You'll see a 'day to day' list view with low HRV days highighted in yellow, very low days in red and high HRV days in green. You'll also see a chart view with your day by day HRV score plotted along with gridlines at low and high levels so you can easily see when you're outside of your own 'normal' range.
How does it work?
The code pulls all 'other' files from TP within that date range, it then cycles through each of these files to calculate RMSSD and SDNN using the math I outlined here. A HRV Score (in this case, lnRMSSD*2) is also calculated for each. The code then calculates a rolling average and standard deviation from each file and will highlight 'high' values in green, 'low' values in yellow and very low values (more than 2x your tolerance level) in red to give you quick visibility on days that...
a) You might want to plan a key workout (green)
b) You might want to be a little more attentive to the training state of particular athletes & consider programming an easy/recovery day (yellow).
c) You might want to consider planning a rest day as your HRV values are significantly lower than your (or your athletes') 'norm' (red)
Yes, this tool also works for coaches! If you have a coach account with training peaks, all you need to do is log in with your coach credentials and you will have access to all of the athletes that you do on your acct. Simply enter the unique athlete number for the athlete data that you want to pull & you can easily keep a (real time) eye on the recovery status of your athletes.
What is the 'tolerance' setting?
The tolerance setting refers to the multiple of the Coefficient of Variation (CV) that if will take to turn the 'high' numbers green and the 'low' numbers red. The default is 1.0, i.e. a difference of 1 CV from the mean. This level will make large changes easy to spot. However, in practice, we may want more sensitivity than that if we want to use this tool to help to better guide us on where we might want to schedule our recovery days for a given week. I typically plan 7-10 recovery days per block & it would seem like a common sense approach to try and schedule these days on the 7-10 days of the block that the athlete is actually the most tired! You may need to dial up the sensitivity of the 'low' days in order to get 7 'reds' per block. I typically find 0.8*CV does the job. The research standard for the 'smallest worthwhile change' (i.e. a score that differs enough from the mean that it can't be written off as 'noise') is set at 0.5*CV so I've also included an option at this level.
A few caveats...
* Files must be saved as 'other'. If you have been saving non-HRV files as other, change the sport type for these to something else, e.g. 'custom'.
* 'Beat to beat' & 1 second recording must be enabled on your device to get accurate data (see how to do so here for the Garmin 920XT (or 620 or Fenix 3) & here for the 910XT. Also, this tool simply pulls the raw data. It doesn't apply any 'smoothing' or correction. Therefore, it will give you different values to any apps that apply proprietary smoothing/correction factors within their algorithm.
********
In addition to the advantage of being able to keep a 'real time' eye on multiple athletes, linking to Training Peaks offers the other HUGE advantage that the athletes' training data is also stored there so we can pull both sets of data and keep track of both sides of the equation - Training stress in, physiological stress out! Some HRV apps attempt to do this by having athletes enter whether they trained 'hard','easy' etc but none come close to the sort of sophistication that you get in quantifying training load from Training Peaks. I'm currently watching the interaction between Training Peaks' performance modelling metrics (ATL,TSB etc) and their resp. impact on HRV with my own athletes and, providing I'm not pushing my limits with Training Peaks API, (Ben, if you're reading this & I am, let me know ;-) I'll show you how you can do this in future posts. Until then..
Train smart,
AC
TweetDon't miss a post! Sign up for my mailing list to get notified of all new content....